FY2023 ANNUAL REPORT
Emerging from drought and making strides toward affordability
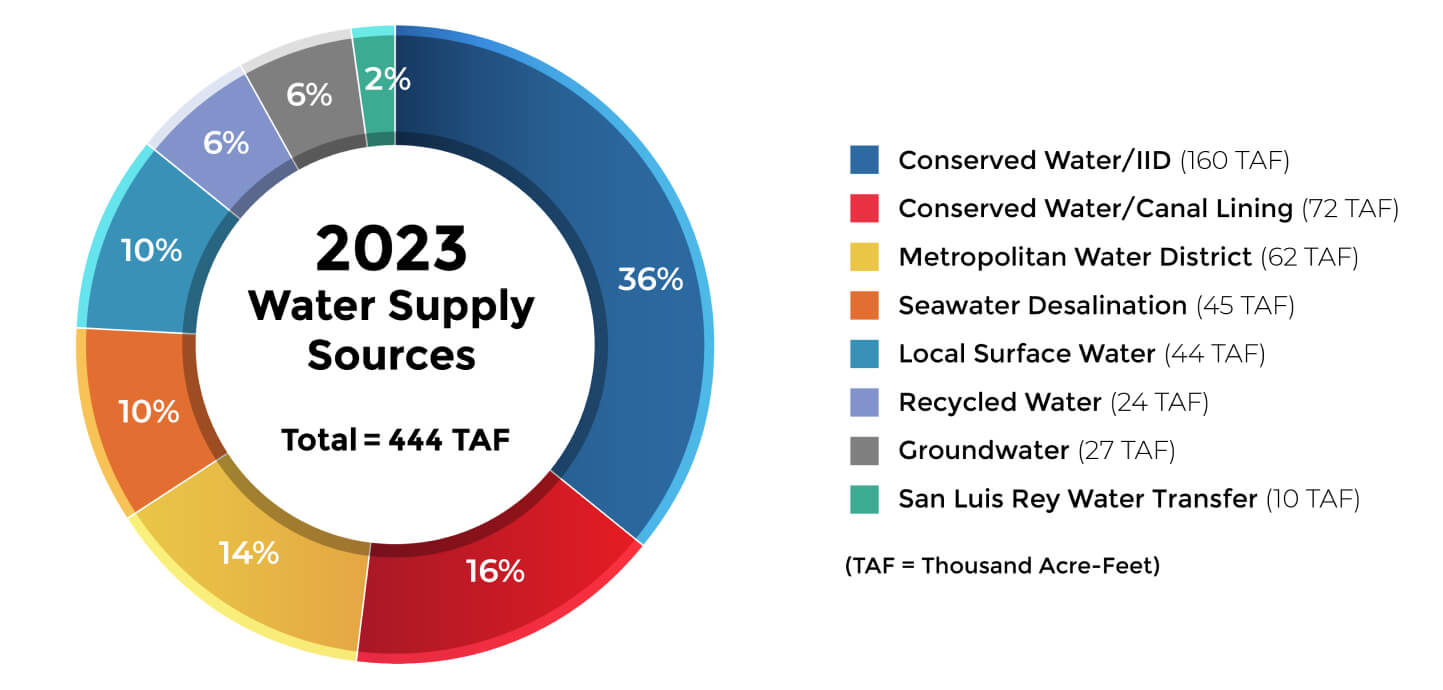
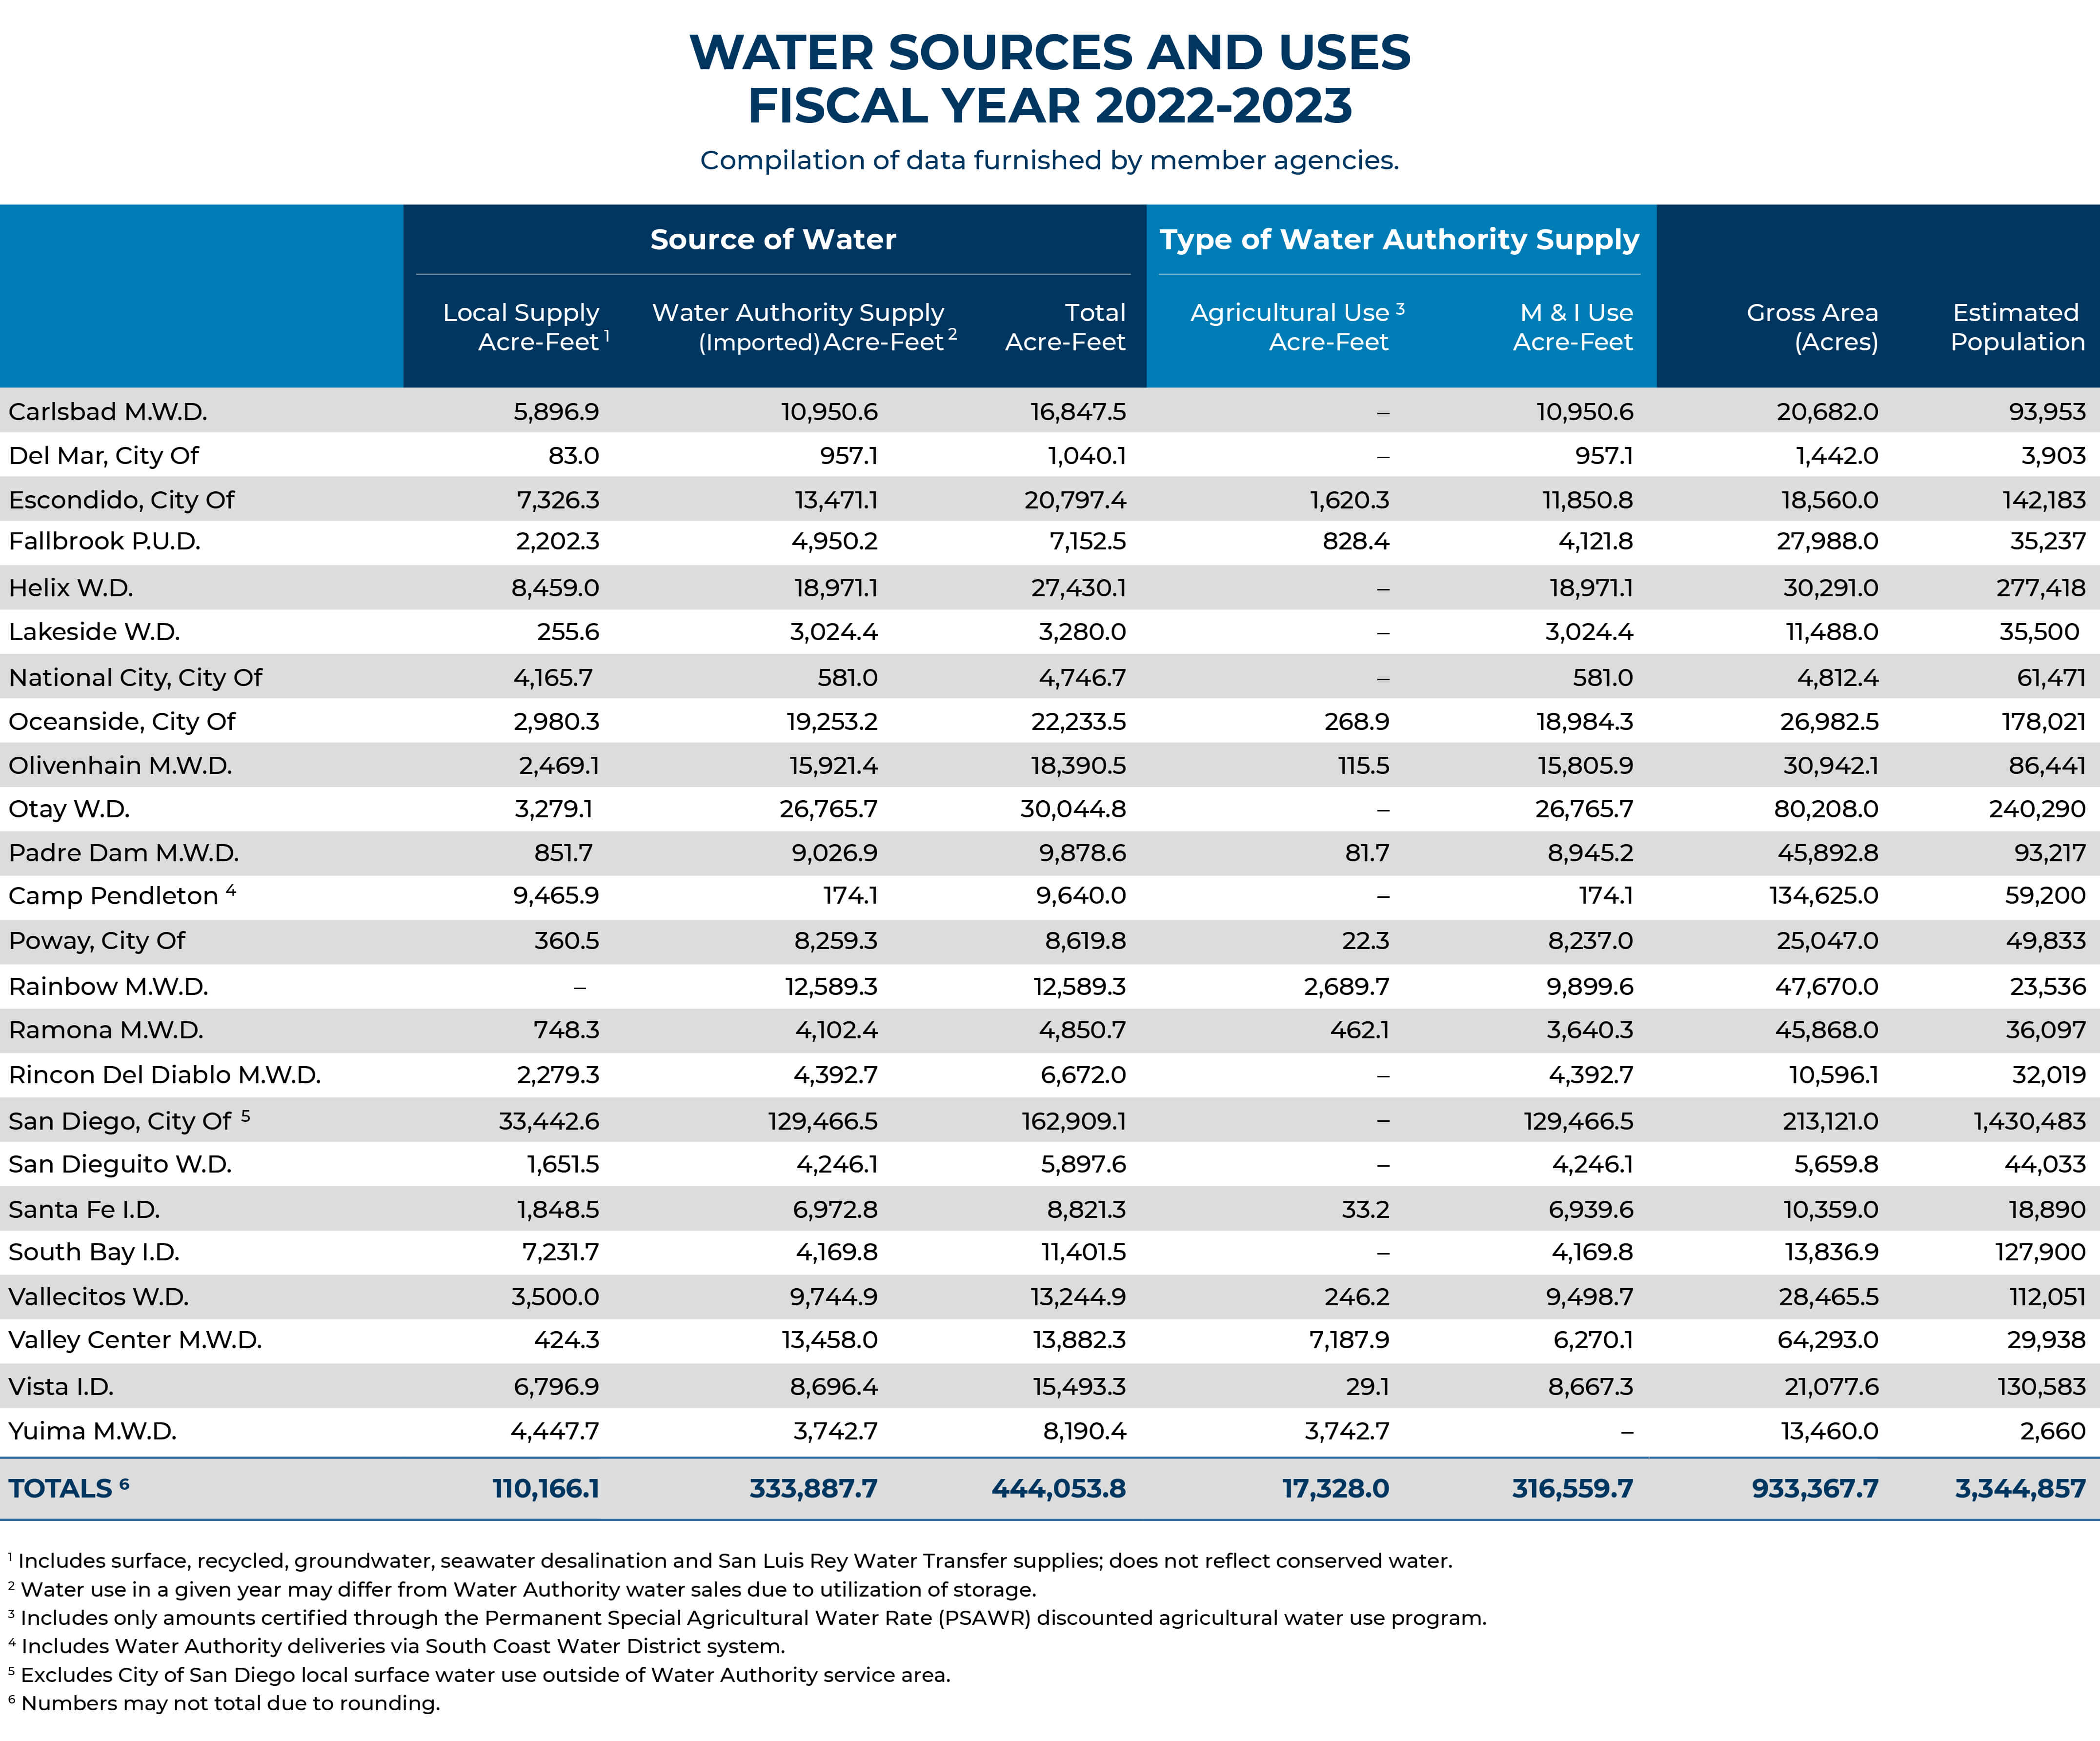
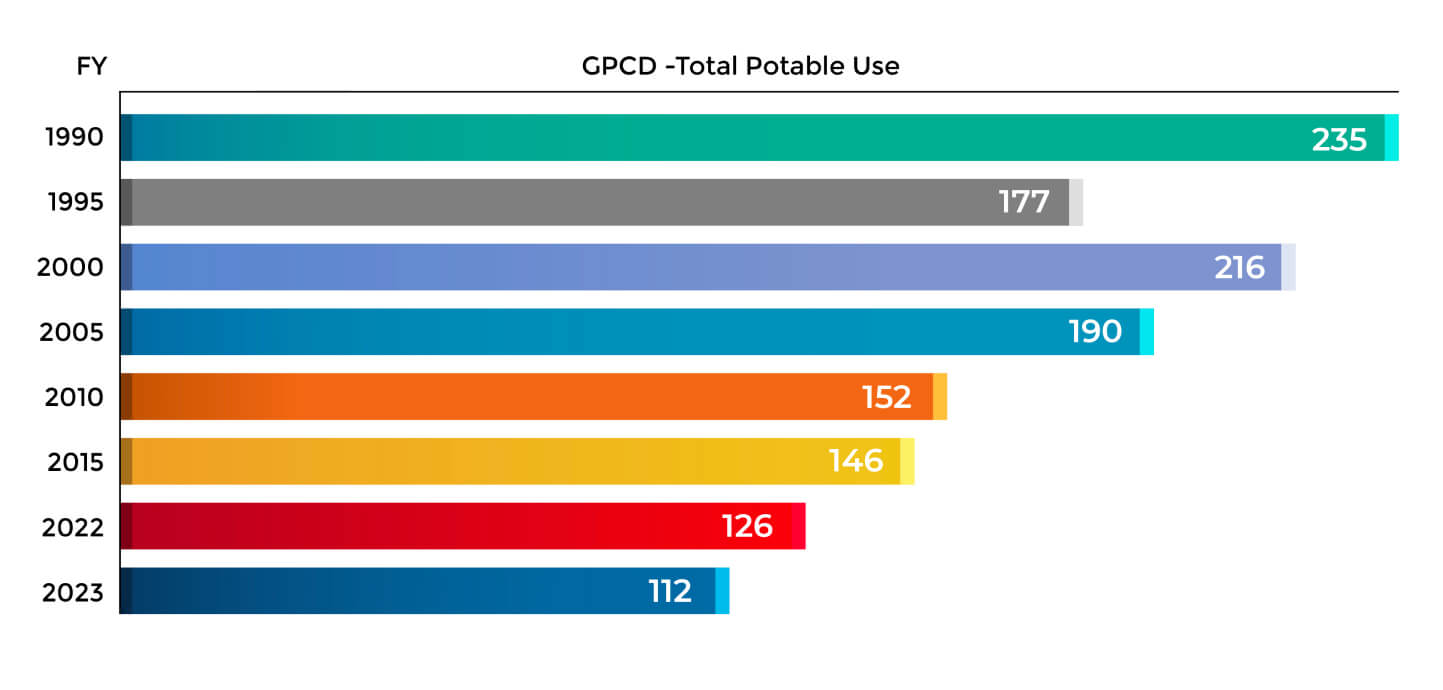
With decades of strategic investments, the Water Authority has emerged as a model for statewide efforts to develop diversified water supply portfolios that can adapt to the changing climate. These assets provide water supply reliability for the region’s economy and 3.3 million residents. Over the past year, the Water Authority continued to prepare the region for an uncertain future.
Top Stories in Water Resource Planning

Snow & Rain Wipe Away Drought Across the West
READ MORE

Big Snowpack Buys Time for Collaboration
READ MORE
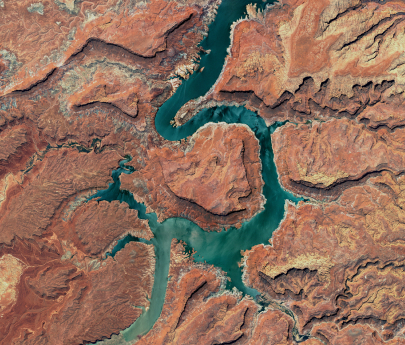
Water Authority Supports Three-State Plan for Colorado River
READ MORE
The Water Authority seeks to maintain the lowest possible rates while working to ensure that everyone in the region has access to safe and reliable water supplies. Water affordability requires coordinated efforts by all levels of government – federal, state, wholesale and retail. They all play a role in the investments in infrastructure needed to transport, treat and deliver water to homes and businesses. In recent decades, retail and wholesale water agencies have borne an increased share of the costs, which has impacted ratepayers. Over the past year, several strategic actions mitigated these financial impacts.
Top Stories in Finance

Major Strides in Water Affordability
READ MORE
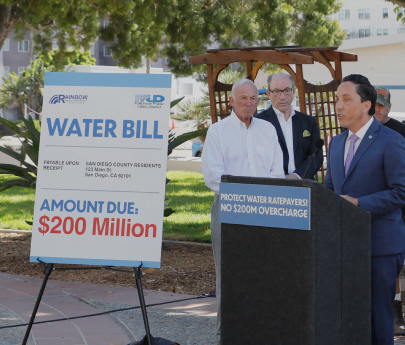
Detachment Raises Financial Challenges
READ MORE
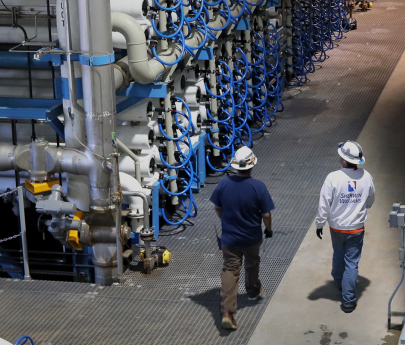
Federal Financing for Desal Plant Saves Ratepayers Millions
READ MORE

Board Approves Rates & Budget
READ MORE
STATEMENT OF REVENUES, EXPENSES, AND CHANGES IN NET POSITION
| Operating Revenues | 2023 | 2022 |
|---|---|---|
| Water Sales | 624,080,766 | 669,277,819 |
| Other Revenues | 1,710,670 | 4,127,735 |
| Total Operating Revenues | 625,791,436 | 673,405,554 |
| Operating Expenses | 2023 | 2022 |
|---|---|---|
| Cost of Sales | 530,364,458 | 563,139,096 |
| Operations and Maintenance | 25,572,960 | 21,527,435 |
| Planning | 9,119,243 | 6,896,841 |
| General and Administrative | 21,458,830 | 20,303,371 |
| Total Operating Expenses | 586,515,491 | 611,866,743 |
| Net Operating Income before Depreciation and Amortization | 39,275,945 | 61,538,811 |
| Depreciation and Amortization | 66,333,231 | 64,893,002 |
| Total Operating Loss | (27,057,286) | (3,354,191) |
| Nonoperating Revenues (Expenses) | 2023 | 2022 |
|---|---|---|
| Property Taxes and In-lieu Charges | 18,670,817 | 16,965,774 |
| Infrastructure Access Charges | 47,418,366 | 47,284,548 |
| Investment Income (Loss) | 9,187,160 | (6,826,393) |
| Settlement Proceeds | 411,888 | 50,520,266 |
| Grant Revenues | 5,958,728 | 8,613,291 |
| Desalination Shortfall Revenues | 4,353,119 | 1,473,385 |
| Other Income | 255,967 | 1,054,783 |
| Intergovernmental | 12,816,816 | 13,303,841 |
| Gain (Loss) on Sale/Retirement of Capital Assets | (5,712,848) | 91,166 |
| Interest Expense | (80,915,023) | (73,865,417) |
| Debt Issuance Costs | - | (949,181) |
| Settlement Rebate to Member Agencies | (411,888) | (46,320,266) |
| Grant Expenses | (6,650,036) | (8,551,018) |
| Project Expenses Write-Off | (24,182,391) | (3,768,002) |
| Other Expenses | (5,186,875) | (4,034,855) |
| Total Nonoperating Revenues (Expenses) | (23,986,200) | (5,008,078) |
| Loss Before Capital Contributions | (51,043,486) | (8,362,269) |
| Capital Contributions | 2023 | 2022 |
|---|---|---|
| Capacity Charges | 21,054,200 | 22,103,246 |
| Water Standby Availability Charges | 11,215,611 | 11,141,972 |
| Contributions in Aid of Capital Assets | 8,885,318 | 1,137,154 |
| Total Capital Contributions | 41,155,129 | 34,382,372 |
| Income (Loss) Before Extraordinary Item | (9,888,357) | 26,020,103 |
| Impairment of intangible asset | (36,538,760) | - |
| Changes in Net Position | (46,427,117) | 26,020,103 |
| Net Position at Beginning of Year | 1,610,006,670 | 1,583,986,567 |
| Net Position at End of Year | 1,563,579,553 | 1,610,006,670 |
STATEMENTS OF NET POSITION
| Assets | 2023 | 2022 |
|---|---|---|
| Current Assets: | ||
| Cash and Investments | 153,102,577 | 169,282,045 |
| Restricted Cash and Investments | 61,460,631 | 94,439,942 |
| Water Receivables | 105,865,746 | 123,104,919 |
| Interest Receivable | 1,681,545 | 1,447,116 |
| Taxes Receivable | 1,261,361 | 1,104,627 |
| Other Receivables | 13,529,953 | 12,992,763 |
| Inventories | 98,103,617 | 79,517,459 |
| Prepaid Expenses | 3,862,726 | 3,720,981 |
| Total Current Assets | 438,868,156 | 485,609,852 |
| Noncurrent Assets | 2023 | 2022 |
|---|---|---|
| Cash and Investments | 88,065,762 | 100,702,863 |
| Restricted Cash and Investments | 112,040,993 | 137,661,339 |
| Advances to Other Agencies | 11,575,149 | - |
| Retention Receivable | 1,822,389 | 1,763,923 |
| Long-Term Loan Receivables | 7,809,847 | 8,149,406 |
| Net OPEB Asset | 1,703,953 | 3,024,505 |
| Capital Assets: | ||
| Non-Depreciable | 106,622,732 | 116,111,507 |
| Depreciable | 3,240,282,527 | 3,273,703,786 |
| Total Noncurrent Assets | 3,569,923,352 | 3,641,117,329 |
| Total Assets | 4,008,791,508 | 4,126,727,181 |
| Deferred Outflows of Resources | 2023 | 2022 |
|---|---|---|
| Deferred Loss on Refunding | 6,045,662 | 12,593,085 |
| Pension Contributions Subsequent to Measurement Date | 9,999,202 | 9,054,406 |
| OPEB Contributions Subsequent to Measurement Date | 293 | 303,260 |
| Deferred Actuarial Amounts Related to Pensions | 16,783,942 | 3,937,860 |
| Deferred Actuarial Amounts Related to OPEB | 1,238,287 | 638,486 |
| Total Deferred Outflows of Resources | 34,067,386 | 26,527,097 |
| Liabilities | 2023 | 2022 |
|---|---|---|
| Accounts Payable and Other Liabilities | 94,779,014 | 92,745,528 |
| Interest Payable | 18,062,993 | 17,833,932 |
| Construction Deposits | 342,448 | 293,971 |
| Short-Term Liabilities | 245,000,000 | 245,000,000 |
| Current Portion of Long-term Liabilities | 61,692,290 | 58,974,539 |
| Unearned Revenue | 7,984,051 | 16,866,818 |
| Total Current Liabilities | 427,860,796 | 431,714,788 |
| Noncurrent Liabilities | 2023 | 2022 |
|---|---|---|
| Long-term Liabilities | 1,962,492,349 | 2,036,137,977 |
| Net Pension Liability | 81,836,796 | 43,454,975 |
| Total Noncurrent Liabilities | 2,044,329,145 | 2,079,592,952 |
| Total Liabilities | 2,472,189,941 | 2,511,307,740 |
| Deferred Inflows of Resources | 2023 | 2022 |
|---|---|---|
| Deferred Gain on Refunding | 6,329,298 | 6,874,566 |
| Deferred Actuarial Amounts Related to Pensions | 321,607 | 23,599,712 |
| Deferred Actuarial Amounts Related to OPEB | 438,495 | 1,465,590 |
| Total Deferred Inflows of Resources | 7,089,400 | 31,939,868 |
| Net Position | 2023 | 2022 |
|---|---|---|
| Net Investment in Capital Assets | 1,228,424,761 | 1,267,186,100 |
| Restricted for Construction Projects | 21,024,338 | 24,001,613 |
| Restricted for Debt Service | 834,037 | 586,676 |
| Restricted for Net OPEB Asset | 1,703,953 | 3,024,505 |
| Unrestricted | 311,592,464 | 315,207,776 |
| Total Net Position | 1,563,579,553 | 1,610,006,670 |
CASH AND INVESTMENTS
| As of June 30, 2023 and 2022, Restricted Cash and Investments Balances Were as Follows | 2023 | 2022 |
|---|---|---|
| Debt Service Reserve | 22,679,650 | 22,434,150 |
| CIP/Bond Construction | 130,284,403 | 186,124,760 |
| Pay-As-You-Go | 20,537,571 | 23,542,371 |
| Total | 173,501,624 | 232,101,281 |
| As of June 30, 2023 and 2022, Unrestricted Cash and Investments Balances Were as Follows | 2023 | 2022 |
|---|---|---|
| Operating | 160,946,414 | 166,270,446 |
| Rate Stabilization | 78,540,740 | 100,702,863 |
| Canal Replacement | 484,147 | 489,332 |
| Equipment Replacement | 1,197,038 | 2,522,267 |
| Total | 241,168,339 | 269,984,908 |
| Total Cash and Investments | 414,669,963 | 502,086,189 |